“Canyon Accident Cause Analysis” is a comprehensive data visualization project designed to present canyon accidents data interactively. The project encompasses the entire process from data collection and cleaning to design and implementation of visualization.
- Roles: Designer, Developer
- Year: 2021
- Tools Used: OpenRefine, HTML, SCSS, Javascript, d3.js
- Demo: canyon-accident-visualization
- Github: canyon-accident-visualization
- Report: Download Report
Project Process and Methodology
- Topic Selection: Chose canyoning accidents for the project, focusing on enhancing safety in extreme sports.
- Data Collection and Cleaning: Sourced data from the International Canyon Accident Database and Ropewiki, followed by data cleaning with OpenRefine.
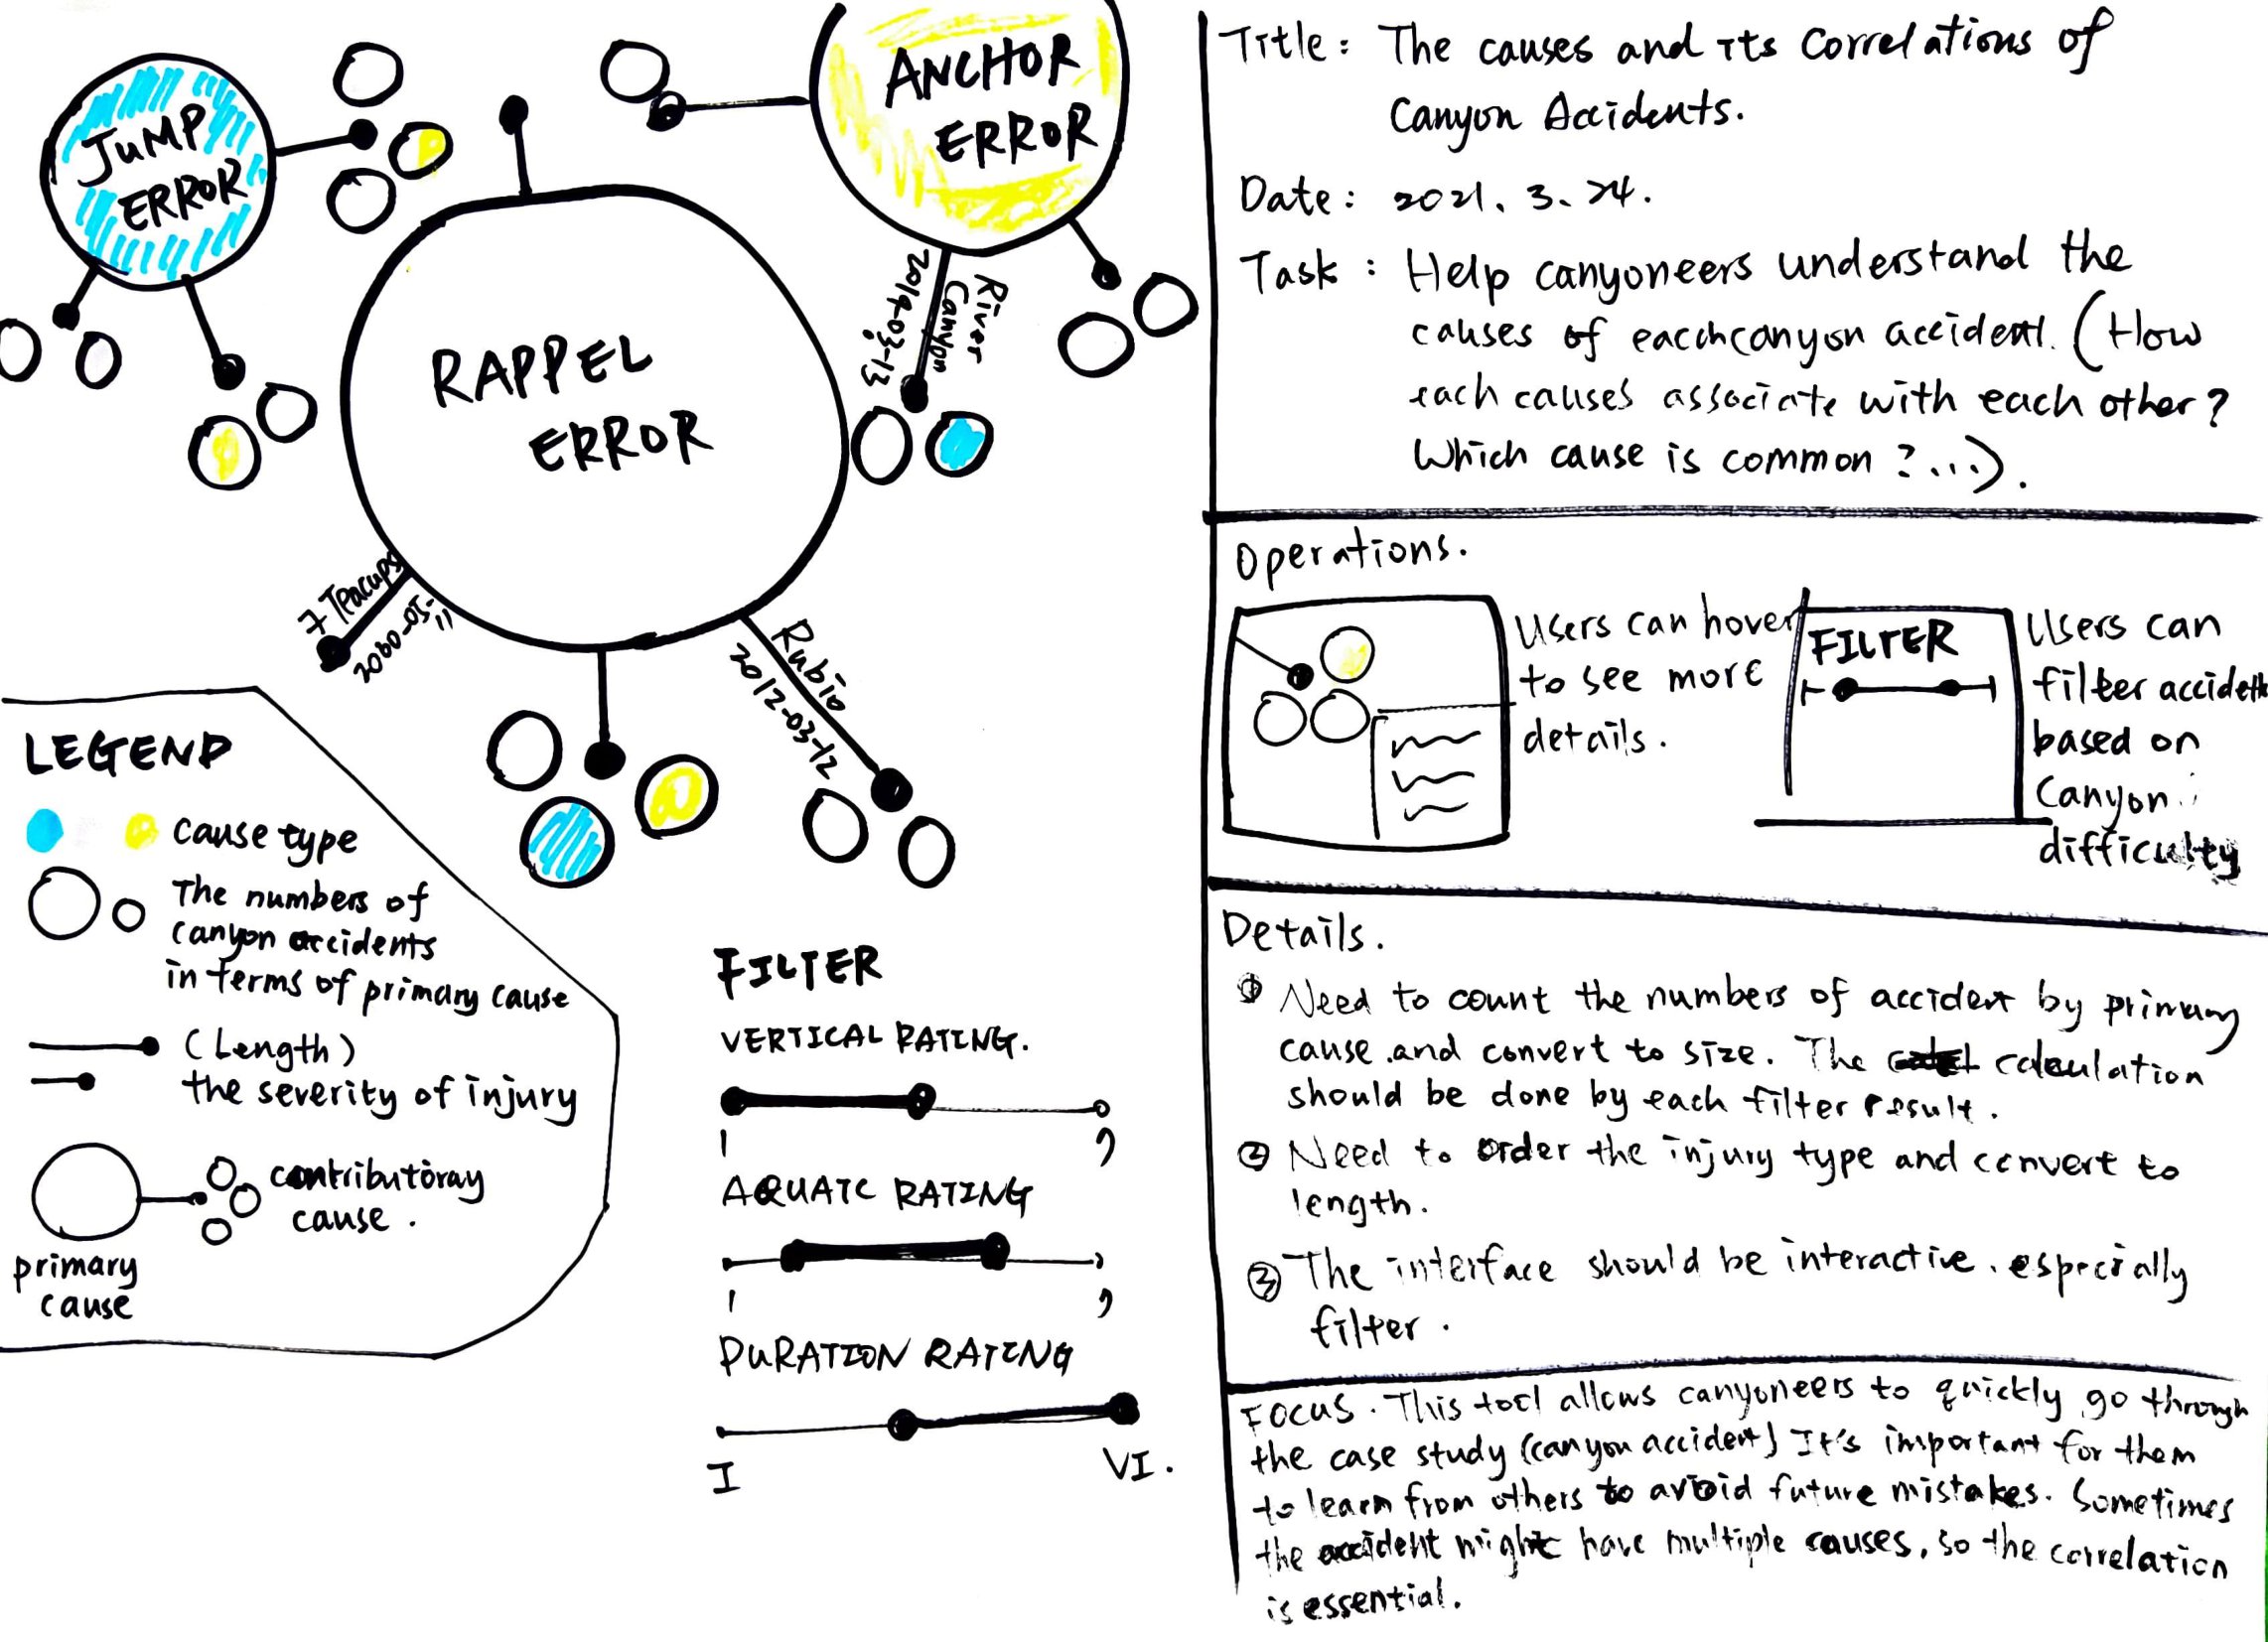
- Design and Sketching: Employed visualization design processes and sketching techniques to plan the data presentation.
- Implementation: Developed the interactive visualization using HTML, SCSS, JavaScript, and d3.js.
Data Source
- International Canyon Accident Database: Provided detailed accident reports including location, time, cause, and type of injuries.
- Ropewiki: Offered information on the location and difficulty ratings of canyons, crucial for contextualizing the accidents.
Challenges
- Integrating Diverse Data Sets: Harmonizing detailed and varied data from different sources into a coherent and interactive visualization.
- Creating User-Friendly Design: Developing an interface that is accessible and informative for both canyoning professionals and enthusiasts.
Solutions
- Rigorous Data Cleaning: Utilized OpenRefine for extensive data cleaning, ensuring accuracy and uniformity.
- Dynamic Data Visualization: Implemented interactive visualizations with d3.js, facilitating user engagement and better understanding of the data.
Technologies Used
- OpenRefine for data cleaning.
- HTML, SCSS, JavaScript for front-end development.
- d3.js for interactive data visualization.
- Visual Studio Code as the integrated development environment.
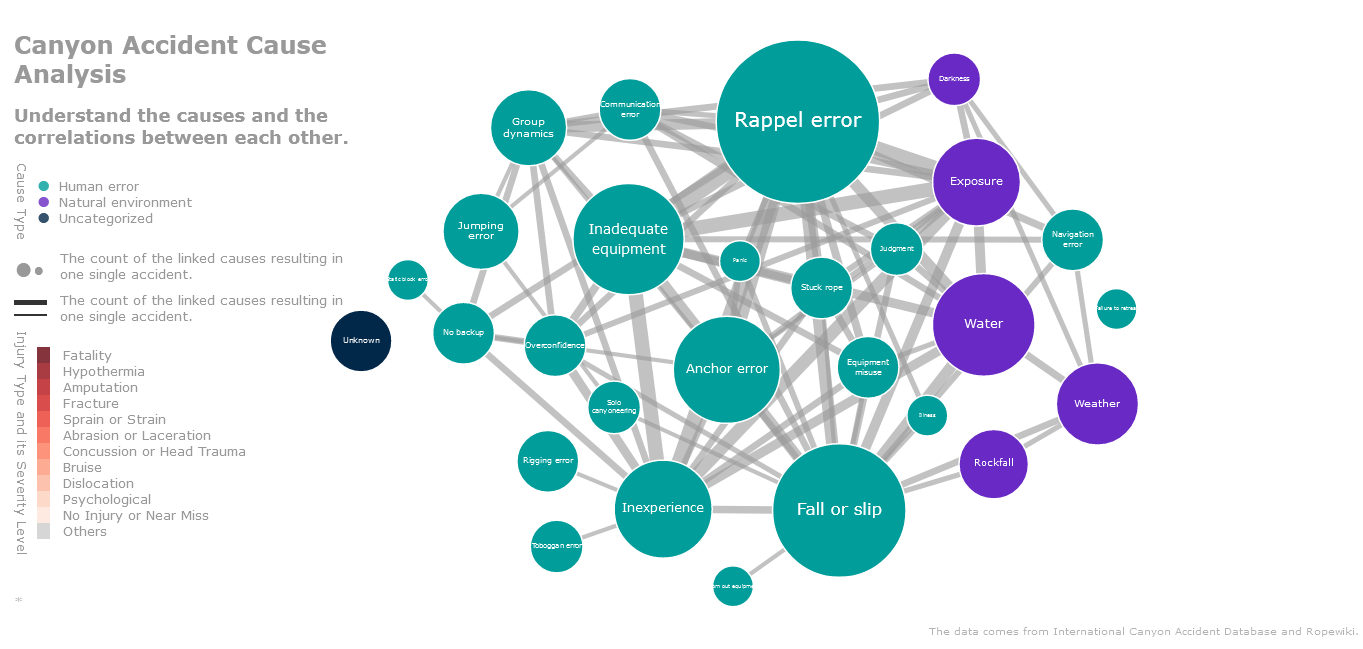
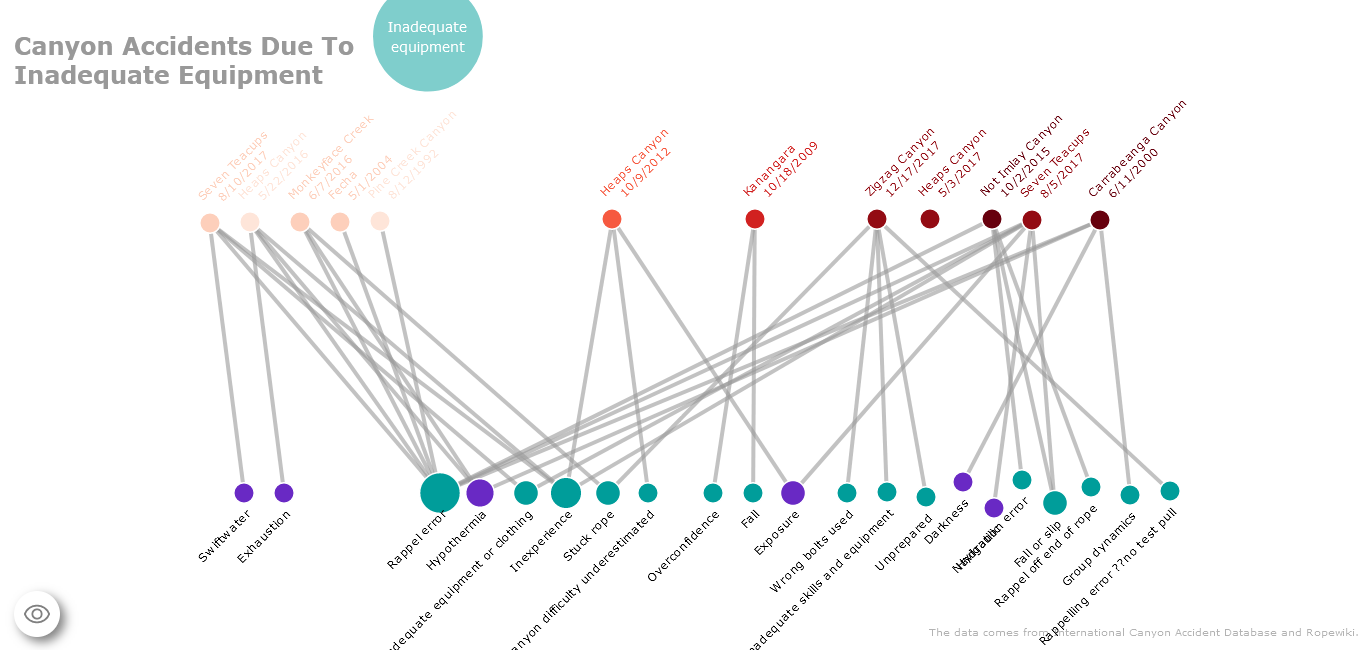
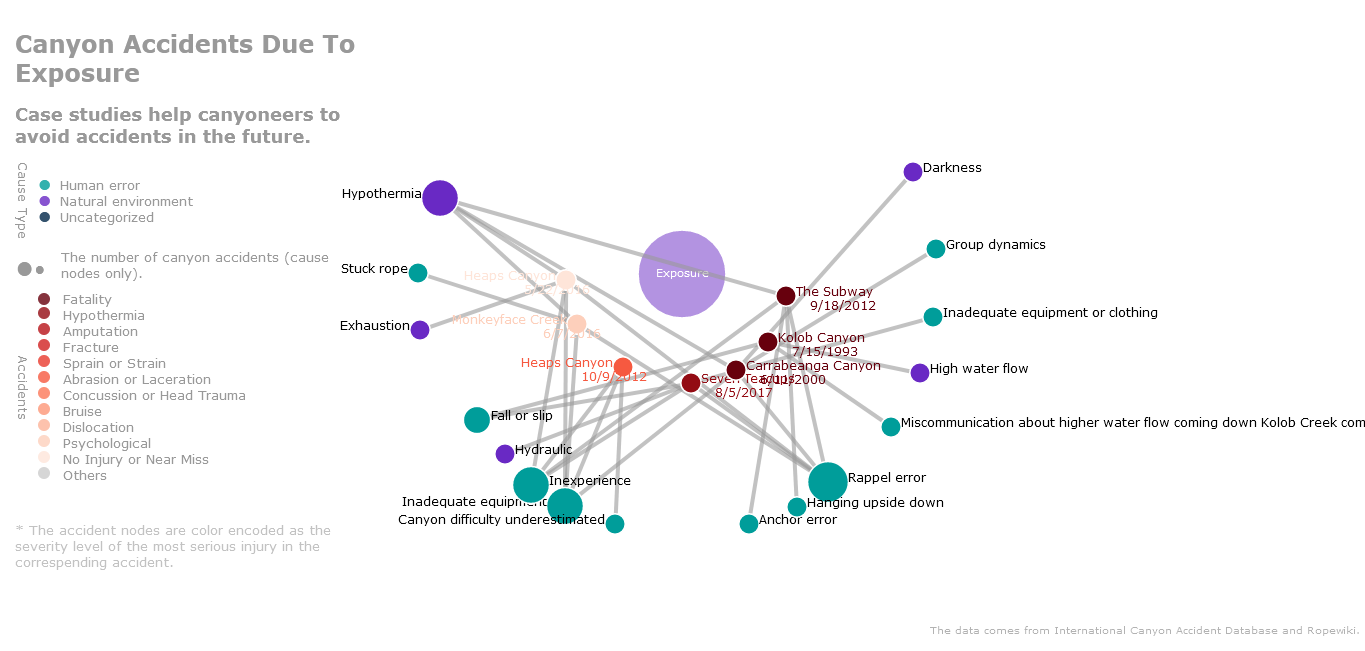
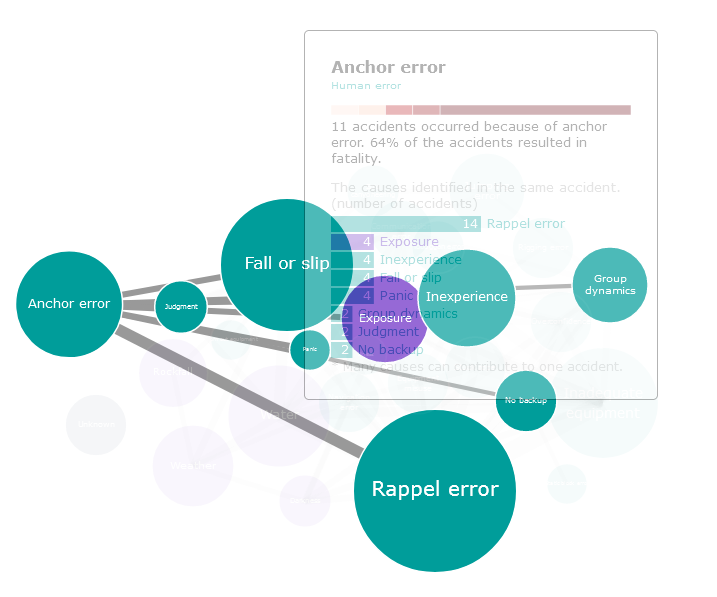
Visualization Showcase
- Sketch
- Final Visualization